Getting Started with the Basic Solution
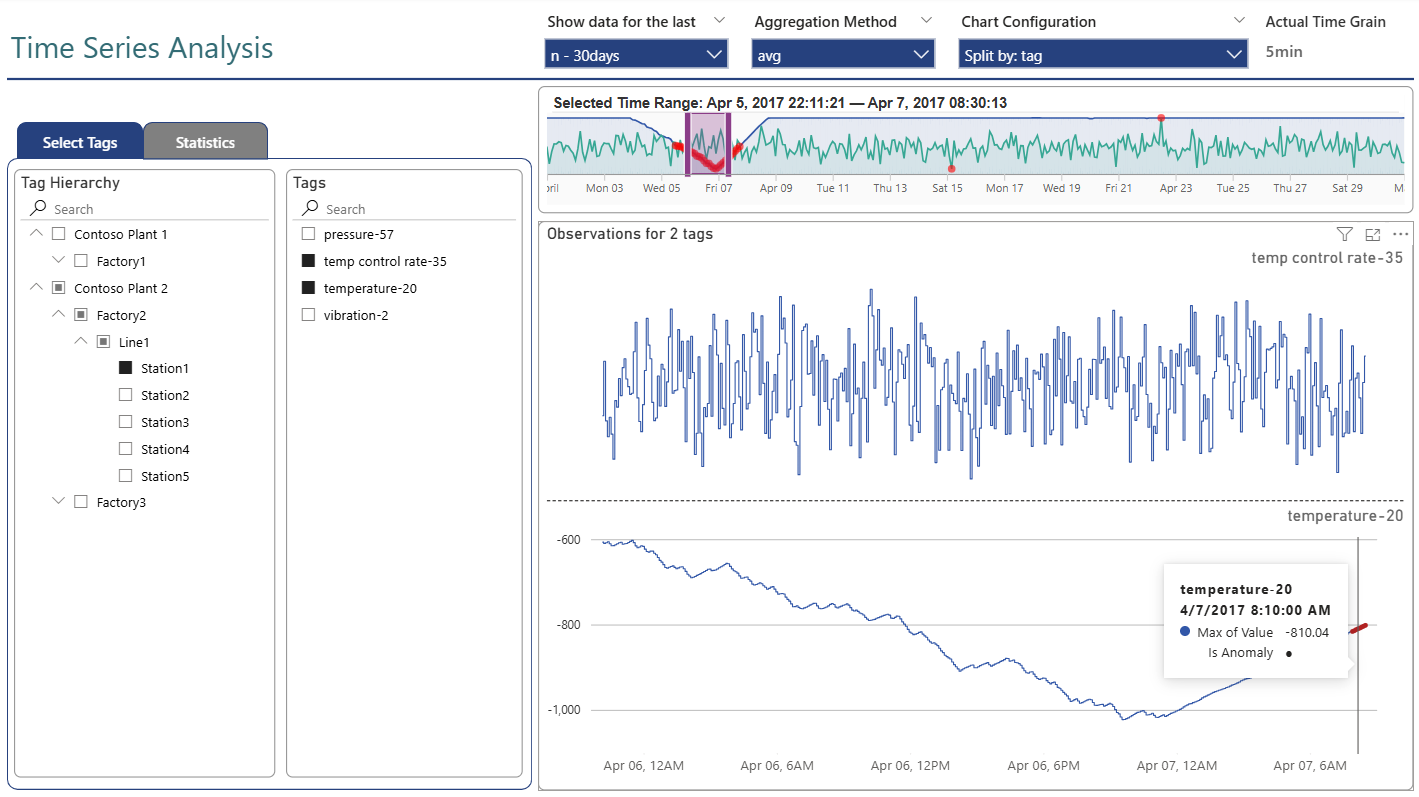
The basic solution demonstrates the concepts of time series data visualization with Power BI and KQL databases using a publicly-available KQL database. More importantly, it can be easily customized to work with your data.
Recommended Skills
| Skill Area | Level |
|---|---|
| KQL | Basic |
| Power BI - Power Query | Basic |
| Power BI - Reporting | Basic |
Prerequisites
- Power BI Desktop installed
- Access to a KQL database (Microsoft Fabric or Azure Data Explorer)
- Access to a Fabric Workspace (to publish and share your report)
Sample Data
This solution uses a publicly-accessible KQL database with sample data. You will need your own KQL database to work with your own data.
Try the Basic Solution
Follow these steps to get started quickly:
-
Download or clone this GitHub repository to your local computer
-
Open the project file in Power BI Desktop:
-
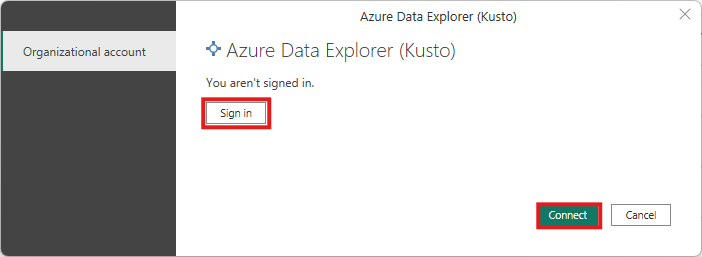
Provide credentials for your Microsoft account to sign into the publicly-available Azure Data Explorer cluster:
-
Start exploring — drag the brush in the time series brush slicer to select time ranges and watch the report update
-
Optionally, publish the report to your Fabric workspace to share with others
Adapt Basic Solution to Work With Your Data
Step 1: Open the Project
- Download or clone this GitHub repository to your local computer
- Open the
Time Series Viz - Basic.pbipfile in Power BI Desktop
Step 2: Open Power Query Editor
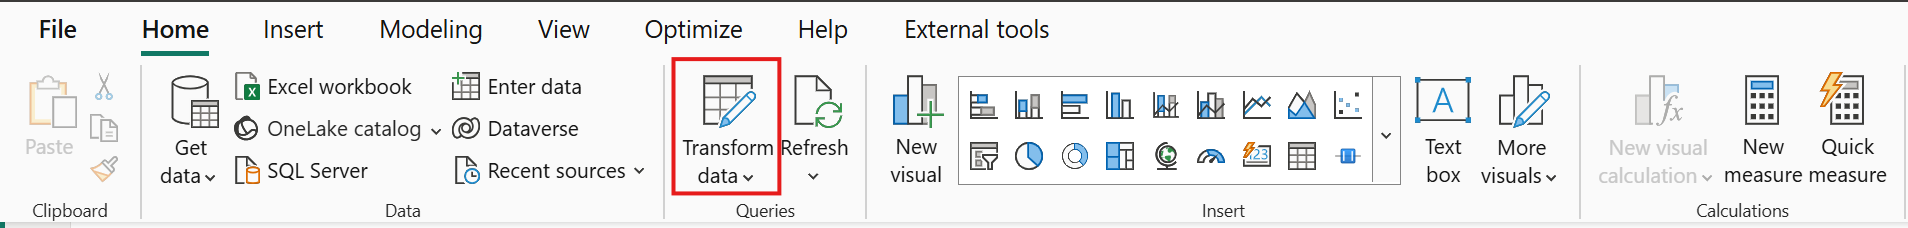
Click on the Transform Data button to open the Power Query window:
Step 3: Manage Parameters
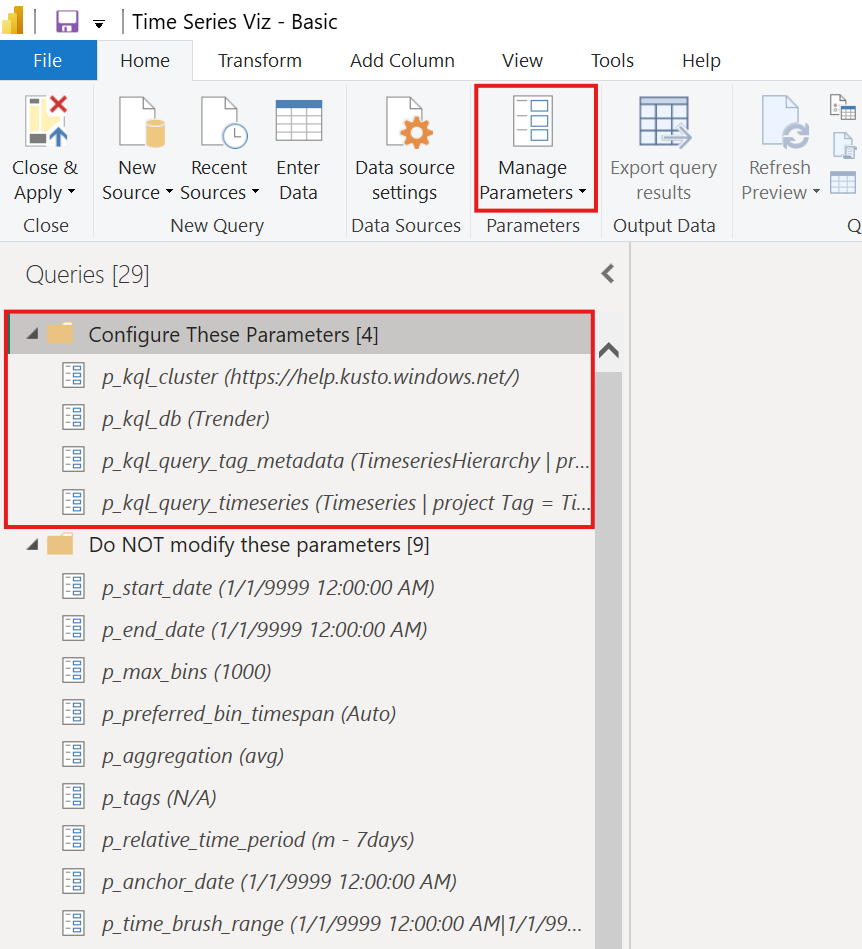
Click the Manage Parameters button:
Step 4: Configure Parameters
Update the following four parameters:
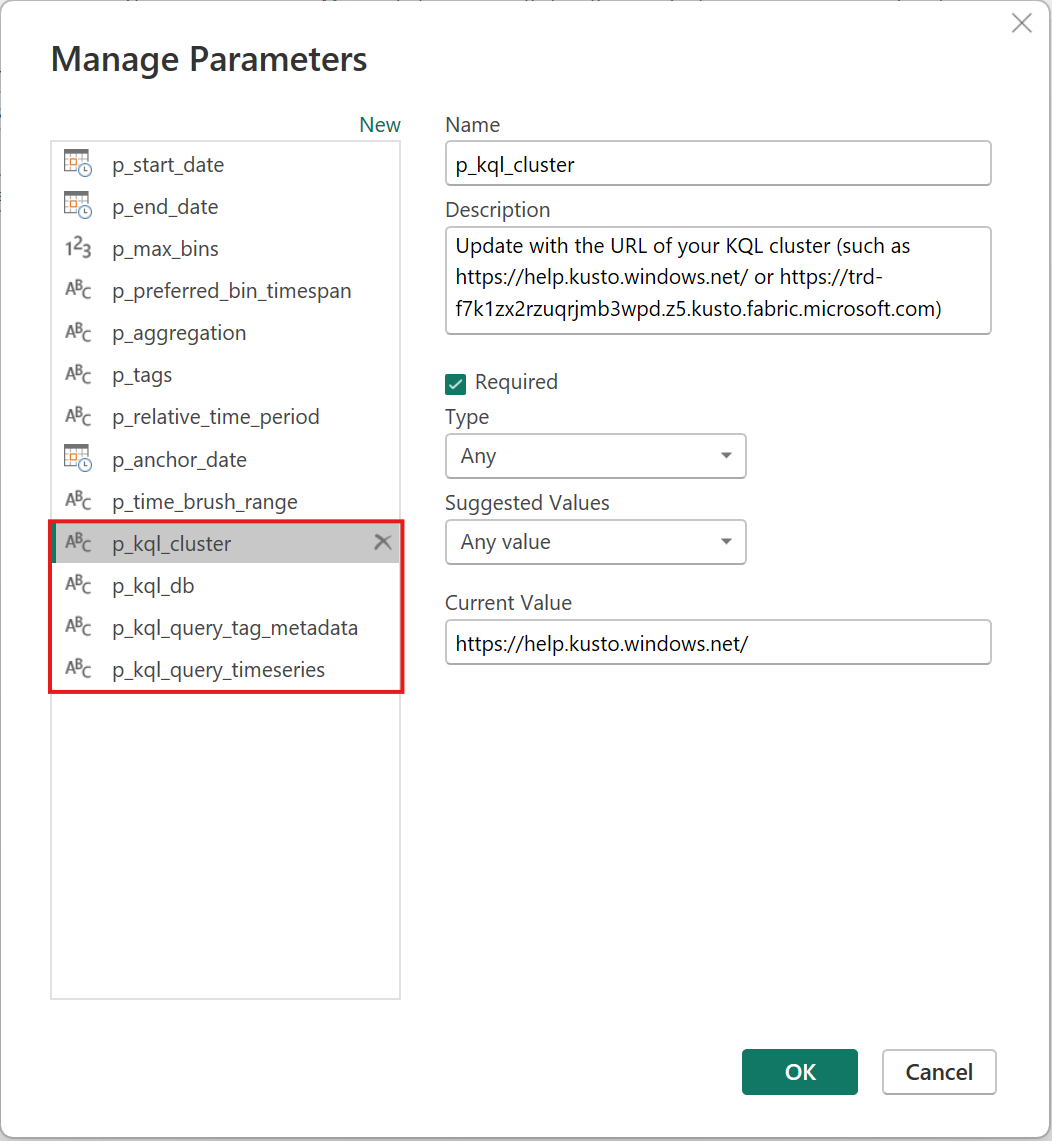
p_kql_cluster
Update with the URL of your KQL cluster, such as:
orp_kql_db
Update with the name of your KQL Database.
p_kql_query_tag_metadata
Update with the base KQL query that will return tag metadata. The query will need to be adapted to the schema of your KQL database.
Required Columns
This query must return the following 6 columns, whose names must match exactly:
| Column | Description |
|---|---|
Tag |
Id of a tag or time series. Must be unique! |
TagName |
User-friendly name of a tag. Must be unique! |
Level1 |
Top level of your tag hierarchy |
Level2 |
Second level of your tag hierarchy |
Level3 |
Third level of your tag hierarchy |
Level4 |
Fourth level of your tag hierarchy |
Example query:
TimeseriesHierarchy
| project
    Tag = TimeseriesId,
    TagName = DisplayName,
    Level1 = tostring(Path[0]),
    Level2 = tostring(Path[1]),
    Level3 = tostring(Path[2]),
    Level4 = tostring(Path[3])
Validate First
Please verify that the query is valid before pasting it here!
p_kql_query_timeseries
Update with the base KQL query that will return your time series data.
Required Columns
This query must return the following 3 columns, whose names must match exactly:
| Column | Description |
|---|---|
Tag |
Id of the tag (corresponds to Tag in tag metadata) |
Timestamp |
Date and time of each event |
Value |
Numeric value for each observation |
Example query:
Step 5: Authenticate
Provide credentials and sign into the KQL database specified by your parameters:
Step 6: Configure Filters and Slicers
Update default filter and slicer settings to match your data.
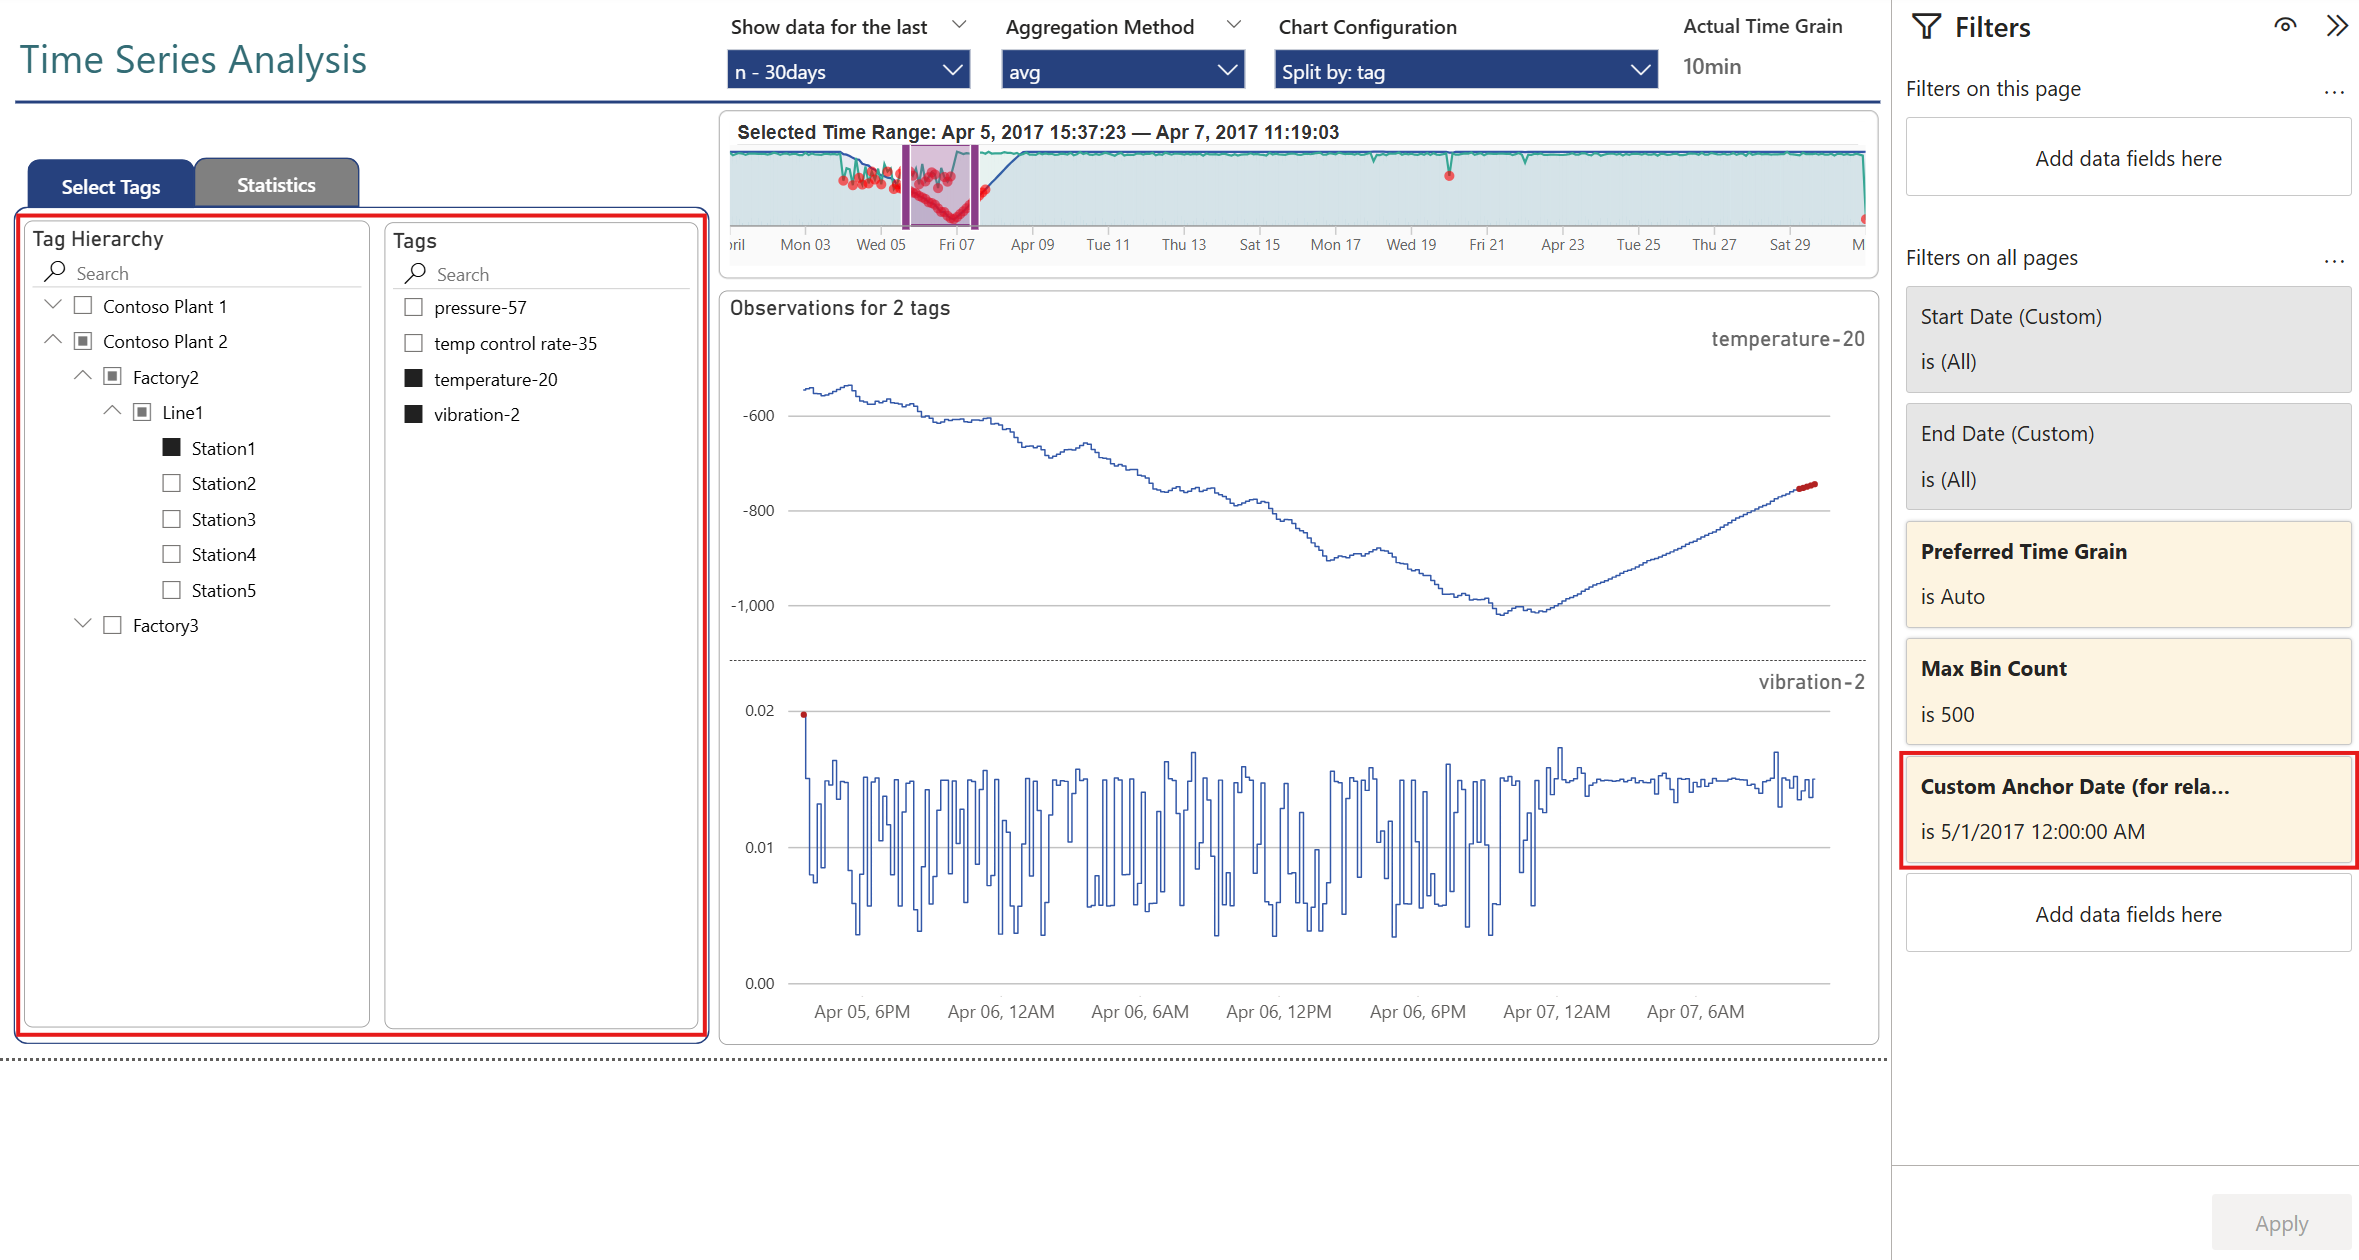
Custom Anchor Date
The sample report specifies a Custom Anchor Date for relative date filtering. This should be either cleared or updated to match your data.
Step 7: Explore and Publish
- Start exploring — drag the brush to select time ranges and watch the report update
- Publish the report to your Fabric workspace to share with others
Next Steps
- Learn about the Advanced Solution for more capabilities
- Explore Configuration Options
- Understand the Architecture